Interactive US Population Map 2025
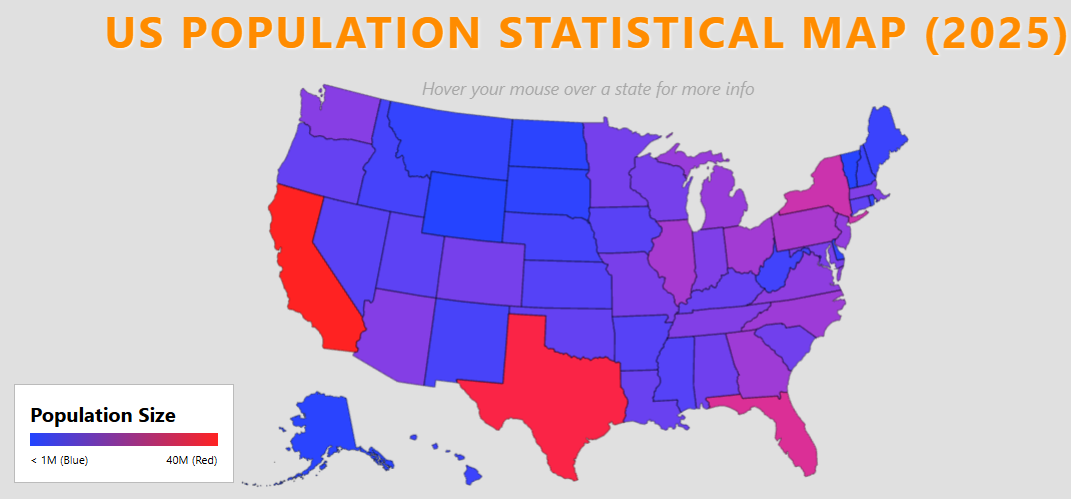
A technically accurate 3D map of the US population. Features real-time state-by-state demographic data, including precise percentage shares of the total national population and gender distribution.
Click here to access.
1. The Core Engine
The logic is driven by a custom State-Level Data Processing Engine that bridges geographic data with statistical metadata.
- Dynamic Data Mapping: The engine uses a central
statsobject containing projected 2025 populations. It maps these values to the properties of the importedgeojsonfeatures. - Feature Traversing: When the
us-states.jsonis fetched, the engine iterates through each feature, creating aTHREE.Groupfor every state. This allows the system to store demographic strings (like gender counts and population share) directly in the group'suserData. - Raycasting Subsystem: A high-performance
THREE.Raycasterruns within the mouse event loop. It translates 2D mouse coordinates into a 3D picking ray to detect which state the user is interacting with.
2. Rendering Technology
The visualization is rendered using WebGL via Three.js, focusing on high-contrast "Choropleth" mapping in a 3D space.
- Color Interpolation (Lerping): The rendering logic uses
lerpColorsto create a smooth color gradient. States with low populations are mapped toward Blue, while high-population states (like California and Texas) shift toward Red. - Vector Geometry Generation: The map doesn't use static textures. It procedurally generates
THREE.ShapeGeometrybased on the geographic vertices, ensuring the map remains sharp at any zoom level. - Anti-Aliased Compositing: The
WebGLRendereris set withantialias: trueand a high pixel ratio to maintain clean edges on the state boundaries.
3. Mathematical Tools
The precision of the map relies on Cartographic Projections and Linear Scaling.
- D3-Geo Projections: The system uses the Albers USA Projection (
d3.geoAlbersUsa). This is a conic, equal-area projection that is the standard for US maps because it minimizes distortion across the 50 states and mathematically nests Alaska and Hawaii near the mainland. - Shutterstock
- Coordinate Transformation: The projection converts Latitude and Longitude into X, Y coordinates. The rendering engine then negates the Y value (
-p[1]) to match the WebGL coordinate system (where up is positive Y) with the screen coordinate system (where down is positive Y). - Population Normalization: The math min((pop - 0.5) / 32, 1) is used to normalize population values into a 0.0$ to 1.0 range for the color interpolator.
4. Front-End Environment
The interface is a Modern ES Module (ESM) setup that integrates standard web UI with a 3D canvas.
- Import Maps: This modern feature allows the code to use "bare imports" (like
import * as THREE from 'three') directly in the browser without a build step (like Webpack or Vite). - Interactive HUD (Heads-Up Display): The state information is not rendered in 3D; it uses a 2D HTML
tooltip. This ensures the text remains perfectly legible and high-resolution regardless of the 3D camera's position. - Responsive Viewport: The environment implements a "Debounced Resize" listener that updates the
camera.aspectandrenderer.setSizeto ensure the map never appears squashed or stretched on mobile or ultra-wide displays. - Integrity Protection: A background "heartbeat" script checks for the existence of the attribution link every 5 seconds. If the branding is tampered with, it triggers a page refresh to maintain developer credit.